What are User Story Maps and How to Use Them
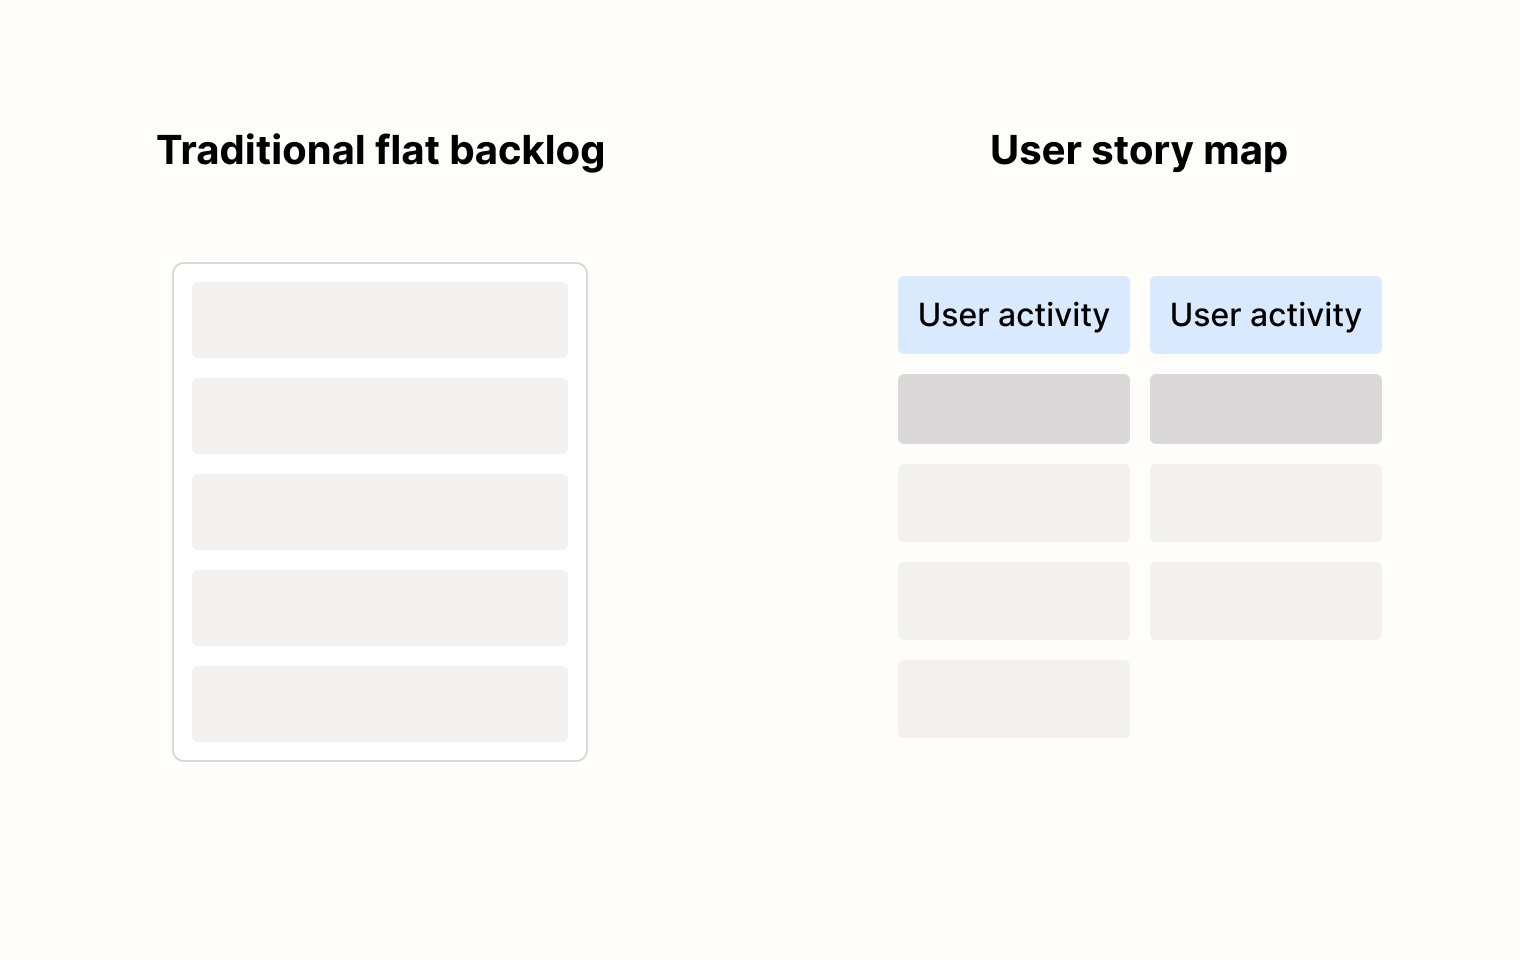
User story maps organize your product backlog into a more visual, user-centered format. They help teams see both the big picture and important details, making them a lightweight alternative to complicated project management systems.
What is a user story map?
A user story map arranges work in two dimensions:
- Horizontally to show the sequence of user activities (the flow)
- Vertically to show priority and implementation detail
Unlike flat backlogs that hide relationships between stories, this visualization helps teams understand how individual stories contribute to the complete user experience.
Brief history
User story mapping was developed by Jeff Patton in the mid-2000s when he noticed agile teams losing sight of user experience while focusing on story points and velocity.
Patton published his first thoughts on story mapping in his 2005 blog post It's All in How You Slice It (pdf) and expanded on the concept in subsequent articles like The New User Story Backlog is a Map (2008). In 2014, he released his comprehensive book User Story Mapping: Discover the Whole Story, Build the Right Product.
The technique has since gained popularity because it bridges the gap between big upfront design and iterative development with minimal overhead.
For example, the Nielsen Norman Group has written about it in their blog.
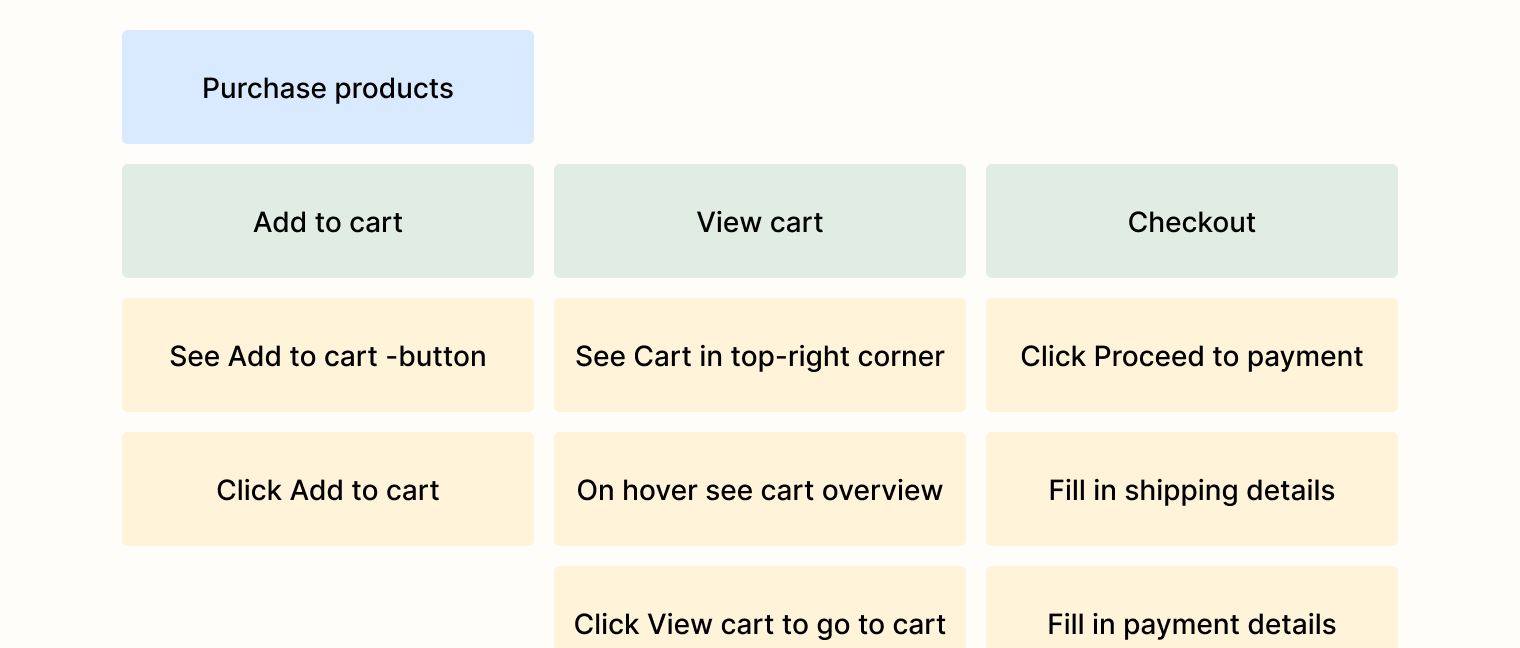
The format of a user story map
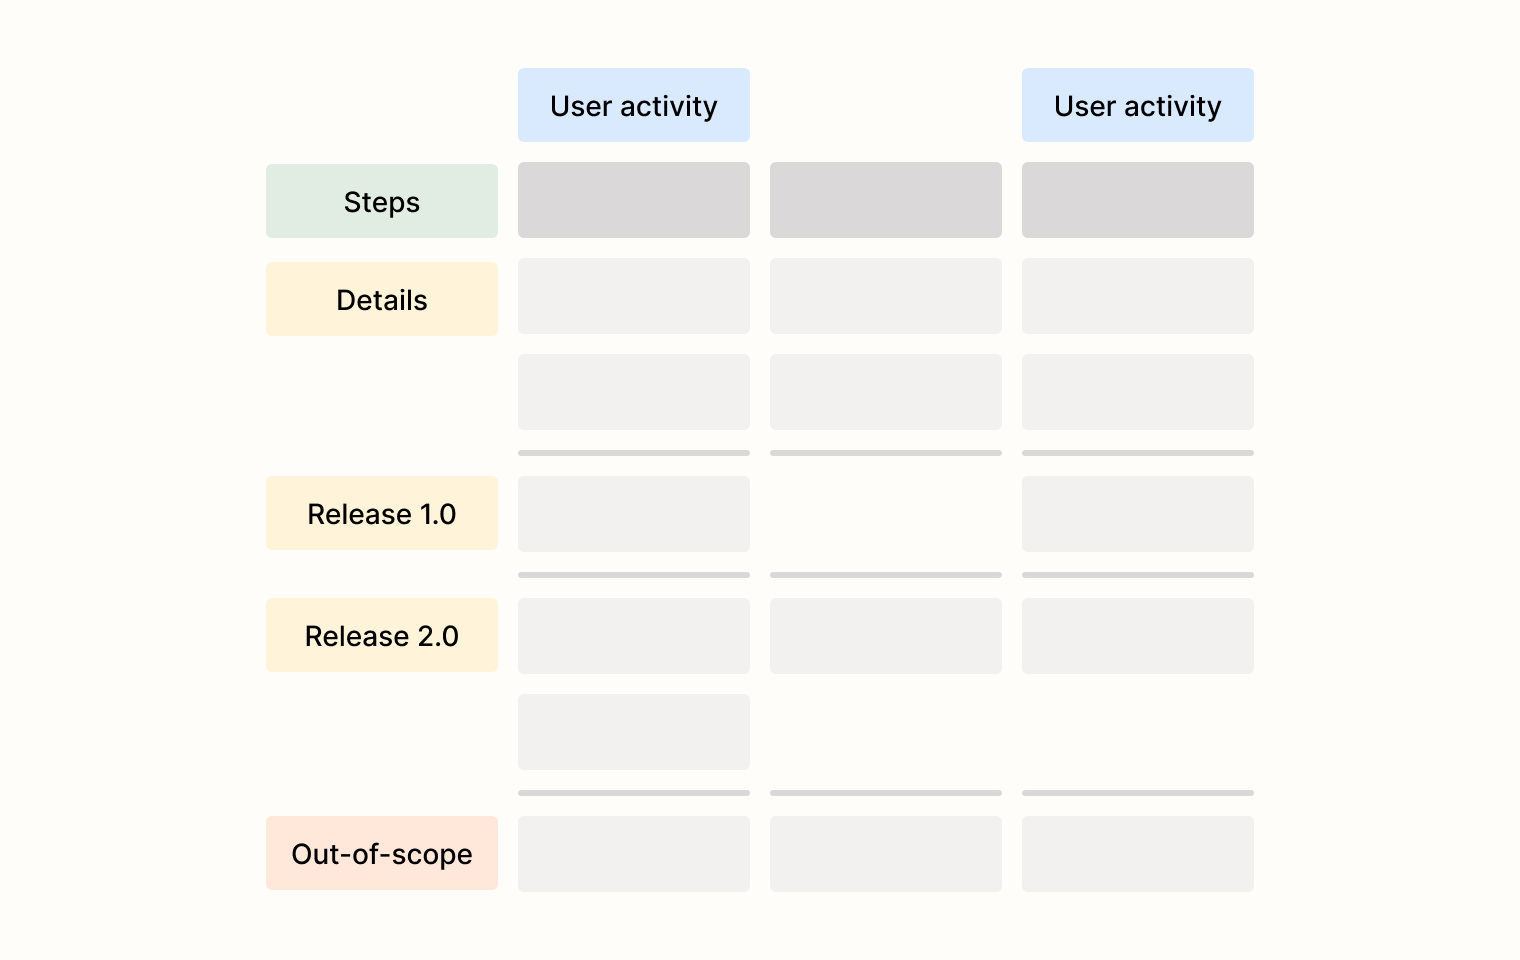
A complete user story map shows the user's journey through your product while organizing implementation details by priority:
For a real-life example, check out this Example user story map.
Activities
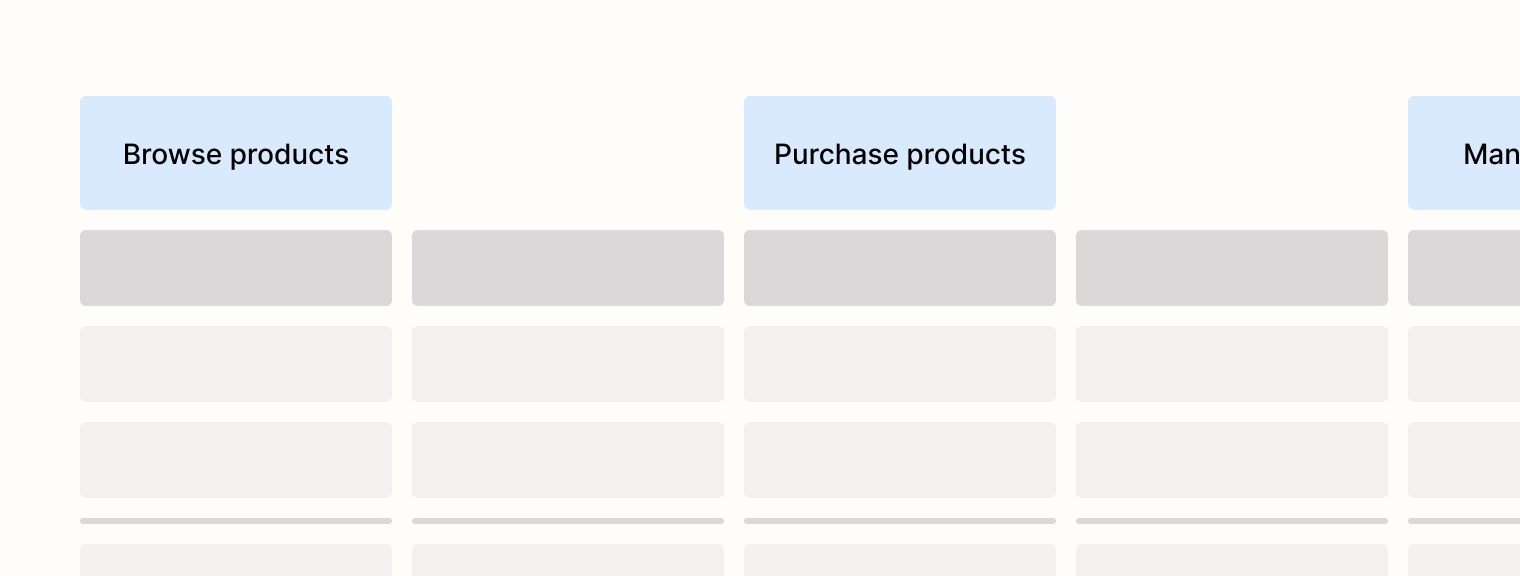
The top row (backbone) shows major user activities arranged sequentially from left to right. These represent the main steps users take when using your product.
Example for an e-commerce site: A user will want to "browse products", "purchase products", "manage their orders", and so on.
Steps
Under each activity, list the specific user tasks or steps needed to complete that activity.
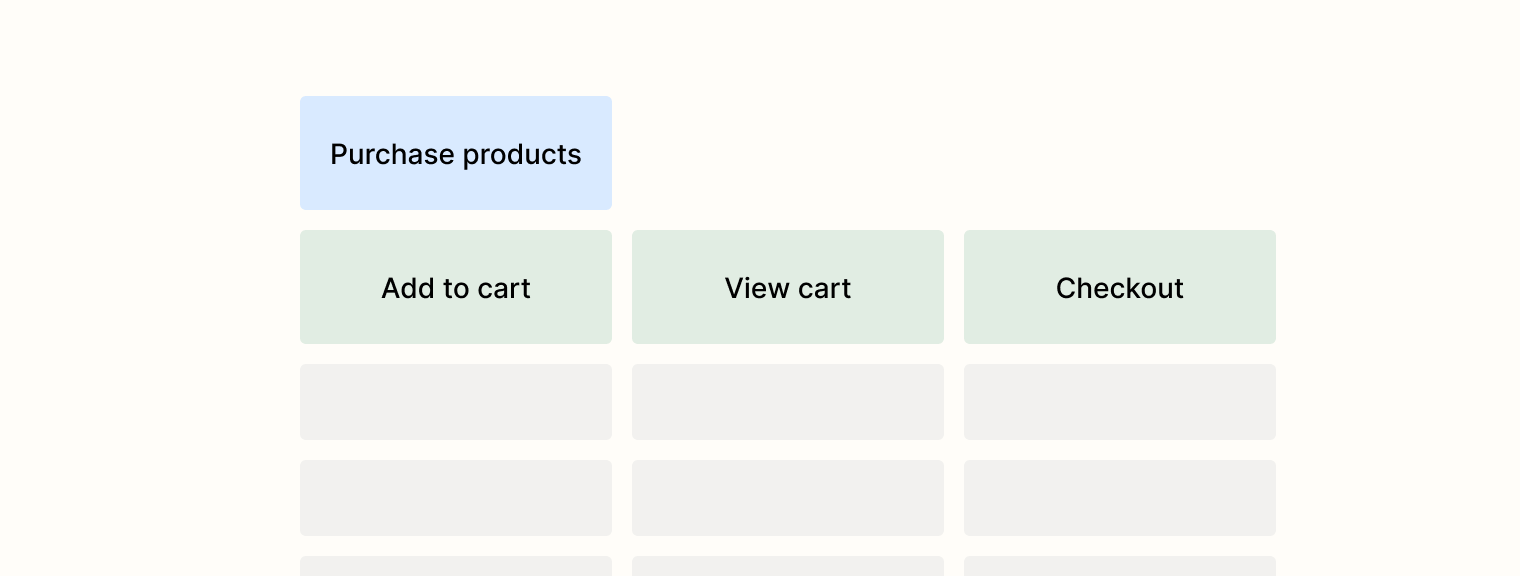
Example: In order to "purchase products", the user needs to "add product to cart", "view cart" and "proceed to checkout".
Details
Below the steps, place user details that implement each task. Higher priority details go at the top, with lower priority below. Usually these are in chronological order.
Example: In order to complete "add to cart", the user needs to "see Add to cart -button" and "click Add to cart -button".
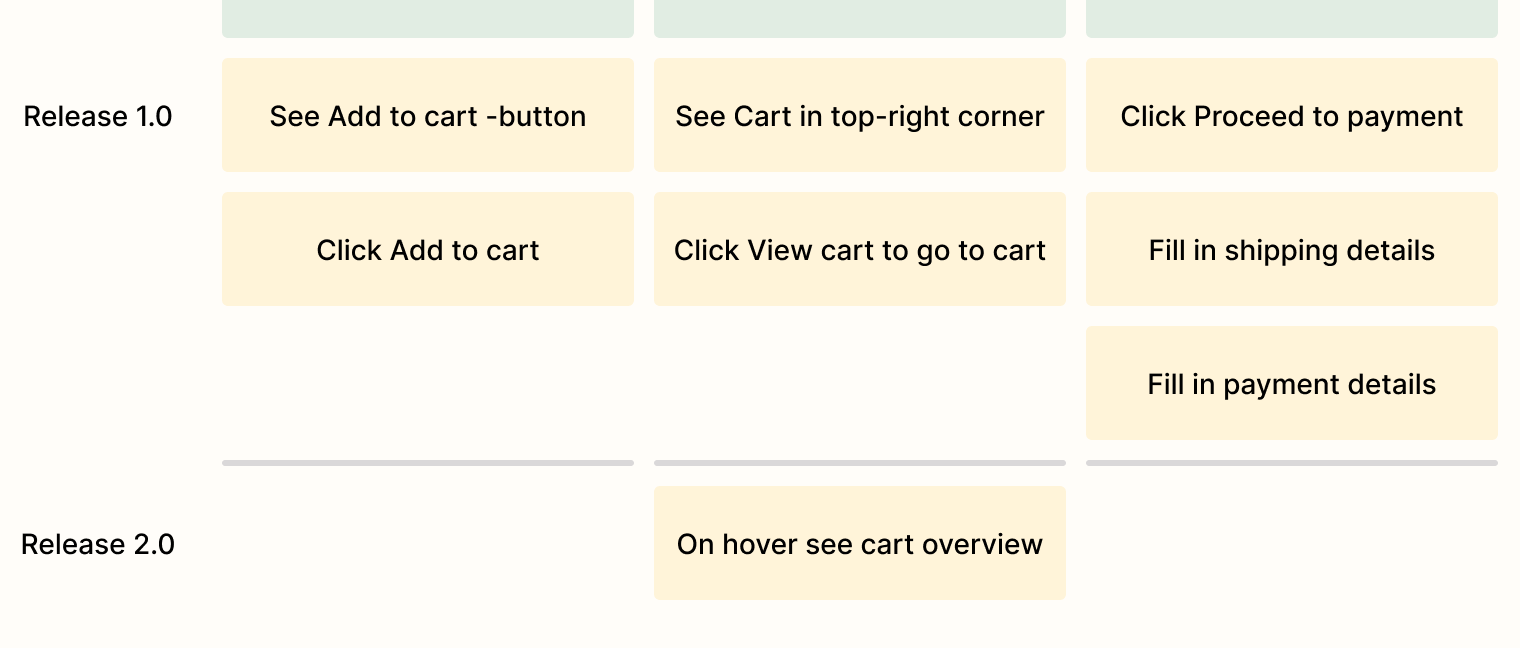
Release slices (optional)
Horizontal lines can be used to divide the map into planned releases. Your MVP sits at the top, with future enhancements below.
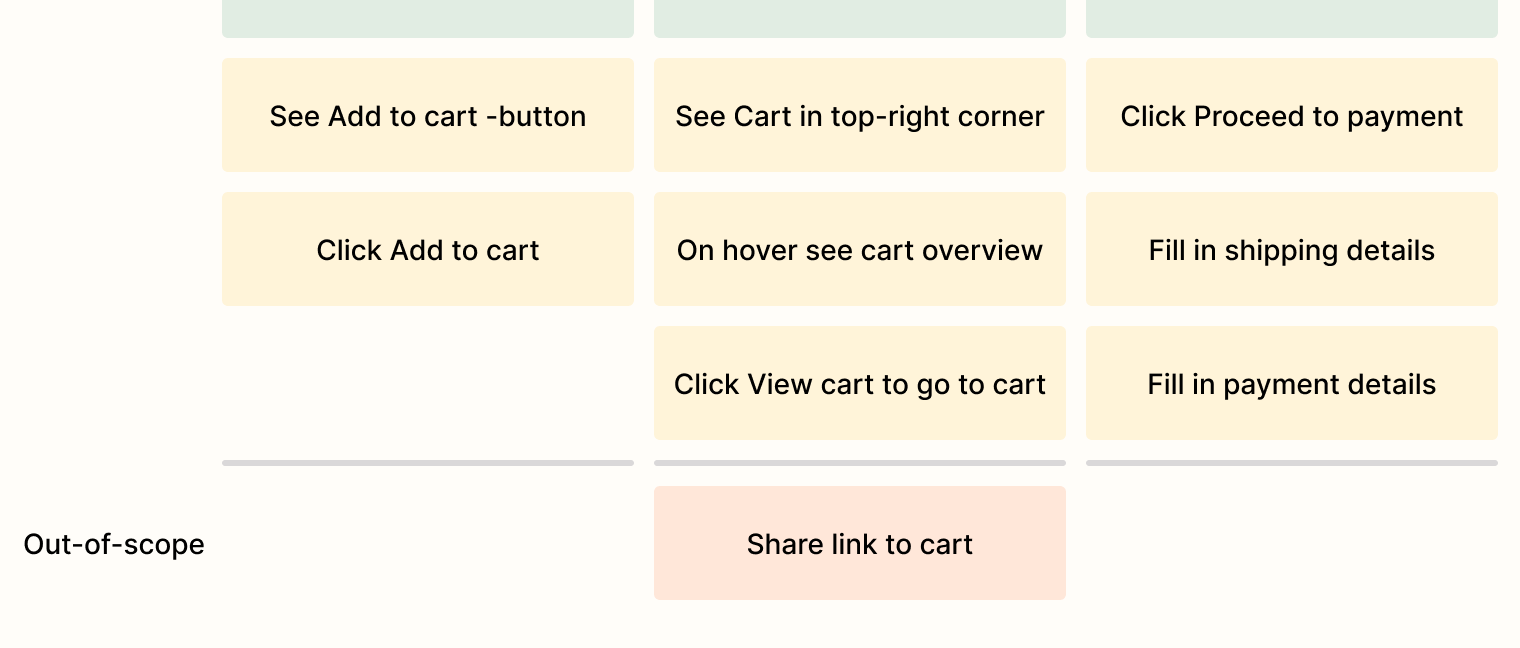
Out-of-scope
One of the greatest things about visualizing a backlog as a user story map is the ability to explicitly mention tasks that should not be worked on (yet).
Items that won't be implemented can be placed at the bottom of the map or in a separate area to show they've been considered but deprioritized.
Why use user story maps?
Focus on user experience
Story maps show how individual features fit into the larger user experience, preventing teams from losing sight of what matters. Missing steps in the user journey become immediately obvious when visualized in sequence.
Teams can discuss the product holistically rather than arguing about isolated features or priorities.
The visual format makes it easier to decide what goes into each release by showing the minimum viable journey.
Also, non-technical team members can easily understand the product vision when it's laid out visually.
Lightweight alternative
Story maps require minimal overhead and can be started with basic materials, unlike complex project management frameworks.
You can easily start with any whiteboard product (like Figma or Miro) you might already be using!
For more options, see our blog post here.
Tools for building user story maps
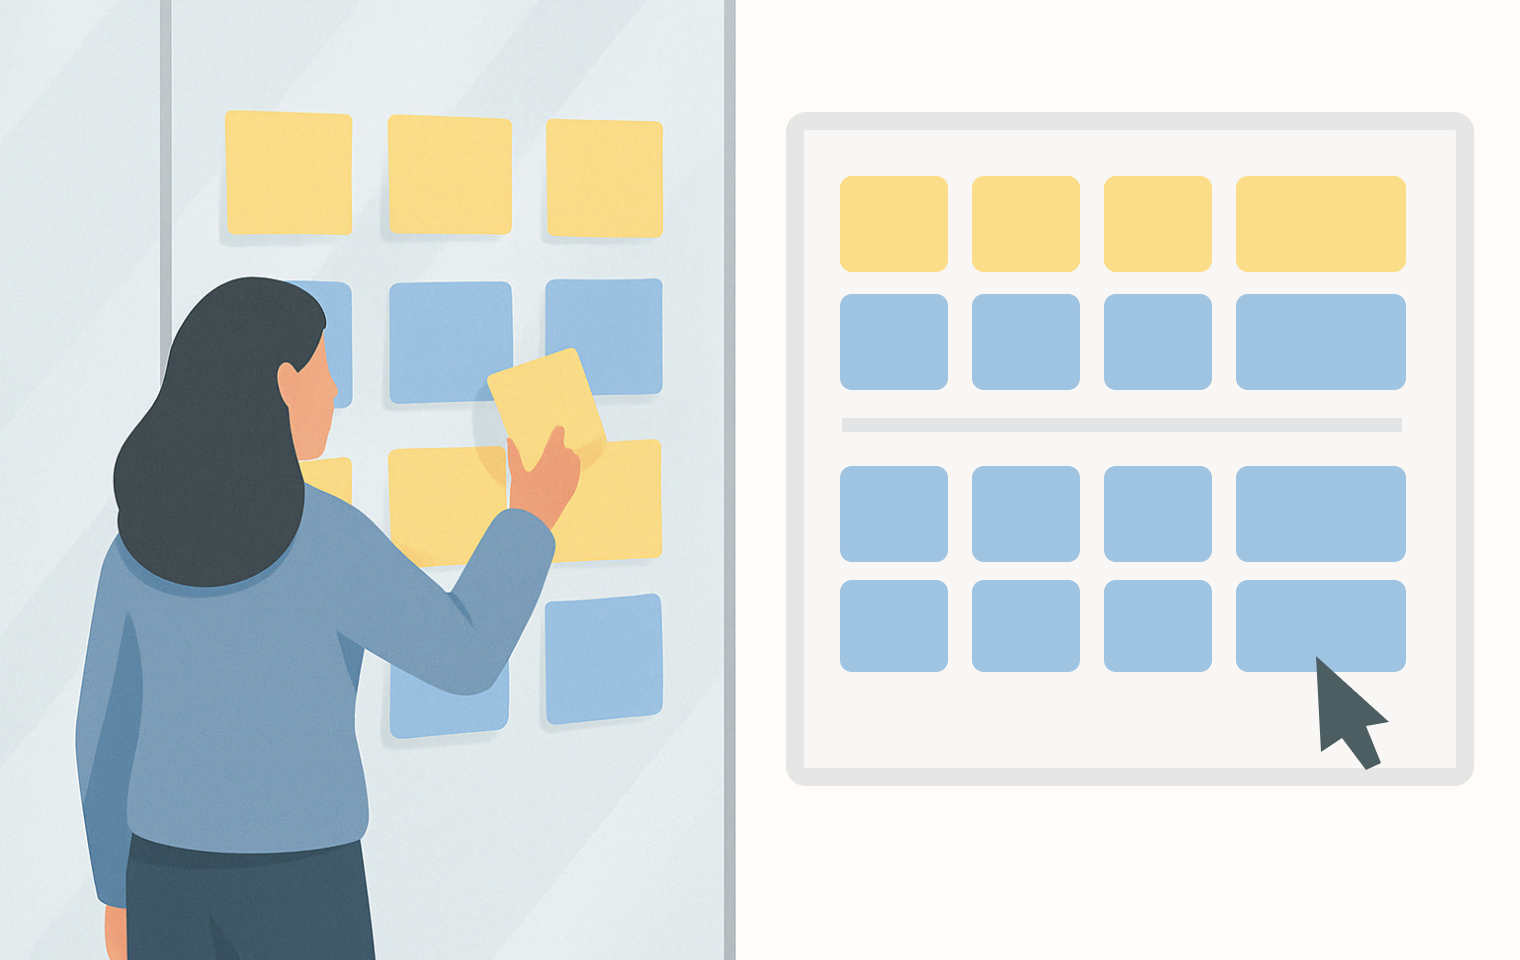
You can work on user story maps in physical or virtual form.
For remote teams, digital tools enable collaboration across locations. Physical maps often create better team engagement when everyone's in the same room.
The key is visibility—keep your story map accessible to the entire team so it remains a living document rather than forgotten documentation.
Physical options:
- Sticky notes and wall/whiteboard
- Index cards and tape
Digital options:
- Collaboration platforms: Miro, Mural, FigJam
- Dedicated tools: StoriesOnBoard, FeatureMap, ProductPlan
For more digital options, see our blog post here.